Image Details
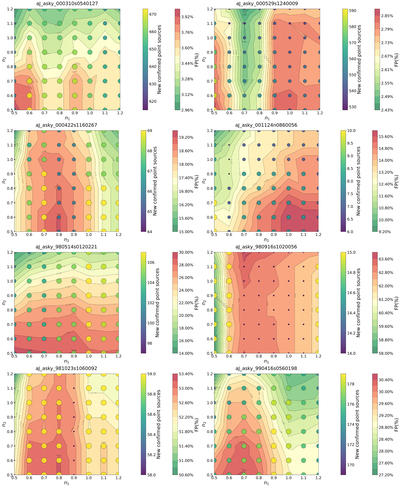
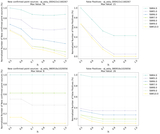
Caption: Figure 1.
The figure shows the variation trends in the number of newly added point sources with an SNR greater than 3 and the false positive rate for eight Atlas images under different detection parameters. The horizontal axis represents the value of the conversion coefficient n1 for ﹩{{\rm{FWHM}}}_{{\rm{\det }}}﹩, and the vertical axis represents the value of the conversion coefficient n2 for the detection threshold. In the figure, variations in the number of new confirmed point sources are represented by different colors and data point sizes, while changes in the false alarm rate are indicated by color gradients and contour lines.
Other Images in This Article
Copyright and Terms & Conditions
© 2026. The Author(s). Published by the American Astronomical Society.