Image Details

Caption: Figure 3.
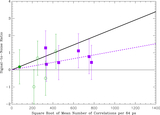
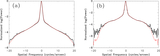
SNR obtained in the final cross-correlation function in each observing session listed in Table 1 as a function of the square root of the mean number of correlations obtained in a 64 ps timing bin. The filled purple squares indicate the results for the new observations presented in Table 1, all of which were with the 532 and 1.2 nm filters. For comparison, open symbols indicate data from Paper I, where the filter parameters are given in the legend. A line of best fit for all data to date is shown as the solid line, and the dotted line at zero is present to guide the eye.
Other Images in This Article
Show More
Copyright and Terms & Conditions
© 2026. The Author(s). Published by the American Astronomical Society.
Copyright ©
2026 Astronomy Image Explorer. All Rights Reserved.