Image Details
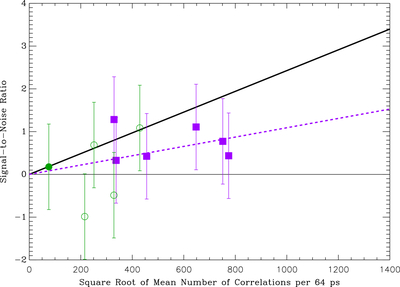
Caption: Figure 7.
SNR obtained in the final cross-correlation function in each observing session listed in Table 2 as a function of the square root of the mean number of correlations obtained in a 64 ps timing bin. The purple squares indicate the results from Table 2, except for the 2017 June 21 data, which are shown as a solid green circle. For comparison, we also include here the data from Paper I as open green circles. Both the 2017 June 21 data and the Paper I data were obtained with a filter of central wavelength/FWHM of λ/Δλ = 532 nm/3 nm. The line of best fit from Figure 3 is shown as the solid line, the dashed purple line indicates the line of best fit for Arcturus, and the solid line at zero is presented to guide the eye.
Other Images in This Article
Show More
Copyright and Terms & Conditions
© 2026. The Author(s). Published by the American Astronomical Society.