Image Details
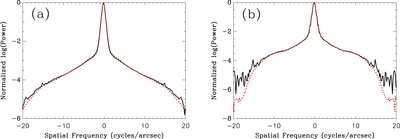
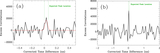
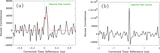
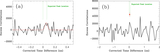
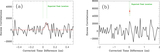
Caption: Figure 10.
A cross section of the 2D power spectrum obtained using speckle imaging. (a) The result at 692 nm. (b) The result at 880 nm. In both plots, the solid line is the power spectrum of the unresolved star HR 5405, and the red dashed curve is the power spectrum of Arcturus. The large peak at low frequencies is caused by seeing, and in both cases, the curves are nearly identical at lower spatial frequencies, but begin to slightly diverge at the higher frequencies shown, with Arcturus having lower power in that region. Note that the curves do not extend to as high a limit for the 880 nm data because the diffraction limit is reached at a lower spatial frequency for the longer wavelength. A higher noise floor is also seen above the diffraction limit for the point source at 880 nm because it is a fainter star than Arcturus.
Other Images in This Article
Show More
Copyright and Terms & Conditions
© 2026. The Author(s). Published by the American Astronomical Society.