Image Details
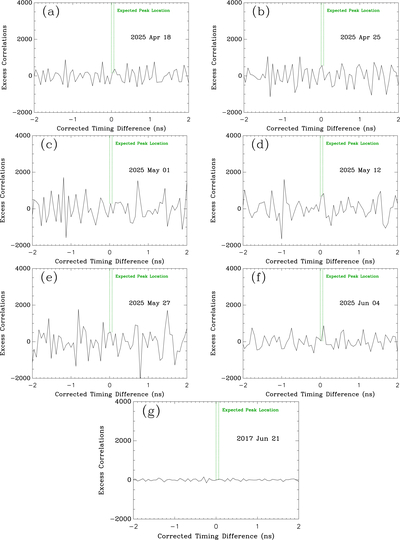
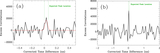
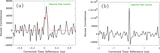
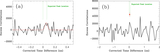
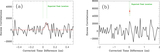
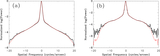
Caption: Figure 6.
Cross correlations obtained for each night listed in Table 2. In each case, the mean number of correlations per timing bin has been subtracted so that the HBT peak is more visible, and the green dotted lines mark the expected locations of the peaks. The two-telescope arrangement discussed in the text was used for all observations here.
Other Images in This Article
Show More
Copyright and Terms & Conditions
© 2026. The Author(s). Published by the American Astronomical Society.
Copyright ©
2026 Astronomy Image Explorer. All Rights Reserved.