Image Details
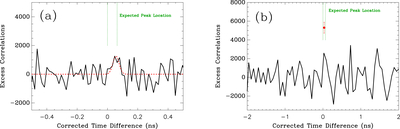
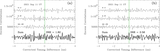
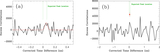
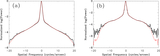
Caption: Figure 9.
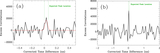
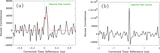
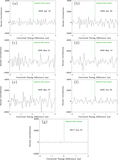
Cross-correlation results obtained on Arcturus for the dataset presented here plus the results in Paper I. (a) In this case, the plots are made binning the timing differences between photon pairs in 16 ps bins. The black solid curve is the data, the red dashed curve is a Gaussian fit to the data, and the green dotted lines indicate the expected locations of the peaks based on the timing corrections made throughout the dataset. (b) The same data, but using a bin width of 64 ps. The red filled circle indicates the signal value expected for full correlation based on the results from Vega in the previous section.
Other Images in This Article
Show More
Copyright and Terms & Conditions
© 2026. The Author(s). Published by the American Astronomical Society.