Image Details
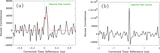
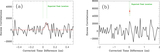
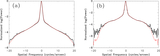
Caption: Figure 1.
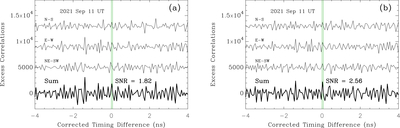
The cross-correlation results for each baseline on 2021 September 11. (a) In this case, the plots are made assuming the nominal position angles for the baselines (i.e., north–south = 180∘, east–west = 90∘, and northeast–southwest = the angle implied by completing the triangle with this baseline as the hypotenuse). (b) The same data, but using the method described in the text for accounting for position angle offsets. In each plot, the data for the individual baselines are offset from the y = 0 line for clarity and the vertical green lines indicate the location of the expected cross-correlation peak.
Other Images in This Article
Show More
Copyright and Terms & Conditions
© 2026. The Author(s). Published by the American Astronomical Society.