Image Details
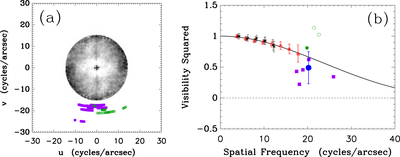
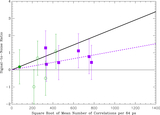
Caption: Figure 11.
(a) The spatial frequency coverage for Arcturus. The grayscale image inside the circle represents the derived spatial frequency power spectrum for the averaged speckle data, extending out to 15 cycles arcsec–1, with darker shades near the edge of the circle indicating lower power. The cross marks the origin in the u–v plane, and the purple and green data points illustrate the observing sessions with the intensity interferometer. The color coding and symbols are the same as in Figure 7. (b) The visibility curve for Arcturus. Here, the red triangles are the radially averaged values of visibility for the 692 nm speckle data, the asterisk symbols are the 880 nm speckle data, and the blue filled circle is the summed result for the intensity interferometry data. Green and purple squares indicate the visibilities obtained for individual observing sessions, albeit with large uncertainties in each case. The colors and symbols are the same as in Figure 7, and three observations included in the final visibility measure fall outside the plot window. The solid curve is the fitted visibility as a function of spatial frequency, and the dashed curve is drawn at zero to guide the eye.
Other Images in This Article
Show More
Copyright and Terms & Conditions
© 2026. The Author(s). Published by the American Astronomical Society.