Image Details
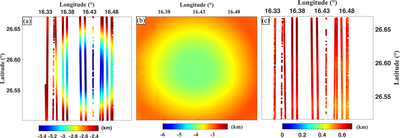
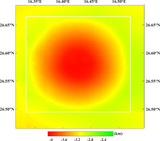
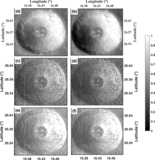
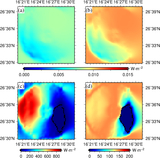
Caption: Figure 4.
DEM distribution map of the BT crater region. (a) The LOLA-sourced DEM. (b) DEM with 1 m resolution generated from multisource LROC imagery and LOLA elevation data using the ISIS and ASP software. The color bar in the figure represents the topographic elevation, visually reflecting the undulating features and geological structure of the crater. (c) Elevation residuals between the reconstructed 1 m DEM and the LOLA elevations at the LOLA footprint locations.
Other Images in This Article
Copyright and Terms & Conditions
© 2026. The Author(s). Published by the American Astronomical Society.
Copyright ©
2026 Astronomy Image Explorer. All Rights Reserved.