Image Details
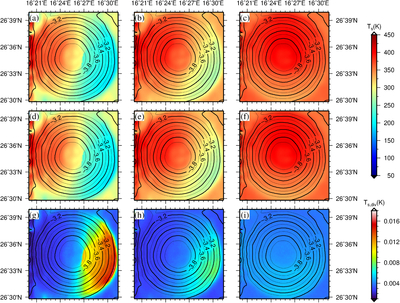
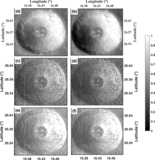
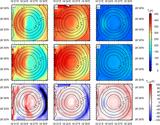
Caption: Figure 10.
Spatial distribution of regolith temperature Ts at the central location of the study area at different LLTs. Panels (a)–(c) do not consider the effect of SSRTEE, and correspond to LLTs 08:02, 10:36, and 12:20, respectively. Panels (d)–(f) consider SSRTEE, and correspond to the same time points in panels (a)–(c). Panels (g)–(i) present the temperature differences corresponding to the time pairs (a)–(d), (b)–(e), and (c)–(f), respectively. The contour map reflects variations in different elevation values.
Other Images in This Article
Copyright and Terms & Conditions
© 2026. The Author(s). Published by the American Astronomical Society.
Copyright ©
2026 Astronomy Image Explorer. All Rights Reserved.