Image Details
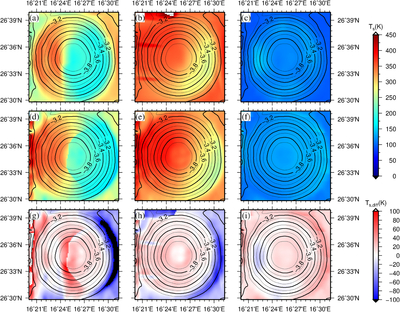
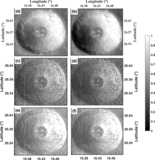
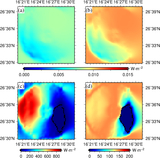
Caption: Figure 8.
Spatial distribution of the regolith temperature in the BT crater at different local times. Panels (a)–(c) shows the Diviner-measured brightness temperatures, while panels (d)–(f) shows the corresponding numerical simulation results at approximate times of (a) 08:00, (b) 09:00, (c) 18:20, (d) 07:44, (e) 09:05, and (f) 18:08, used to verify the reliability of the simulation results. Panels (g)–(i) present the temperature differences (panels (a)–(d), (b)–(e), and (c)–(f), respectively). The contour map reflects variations in different elevation values.
Other Images in This Article
Copyright and Terms & Conditions
© 2026. The Author(s). Published by the American Astronomical Society.
Copyright ©
2026 Astronomy Image Explorer. All Rights Reserved.