Image Details
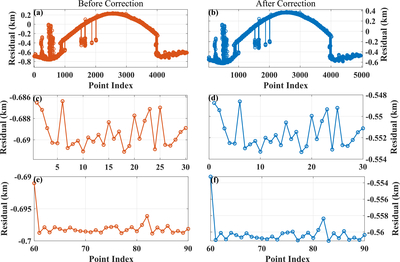
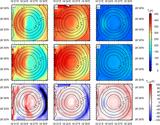
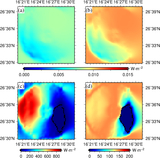
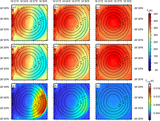
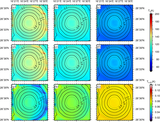
Caption: Figure 6.
Elevation residual analysis between the DEM constructed from LROC imagery combined with LOLA elevation data and the LOLA measurements. Panels (a)–(b) show the residual distributions for all comparison points, while panels (c)–(f) display the local residual variations for point index ranges 1–30 and 60–90, illustrating the trends before and after correction, respectively.
Other Images in This Article
Copyright and Terms & Conditions
© 2026. The Author(s). Published by the American Astronomical Society.
Copyright ©
2026 Astronomy Image Explorer. All Rights Reserved.