Image Details
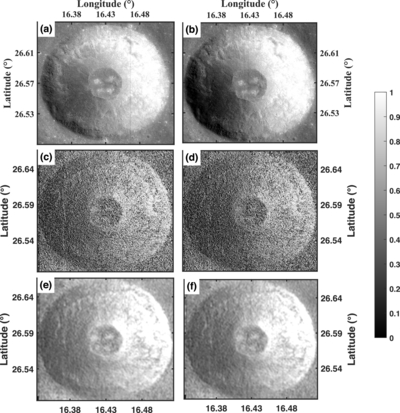
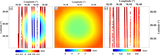
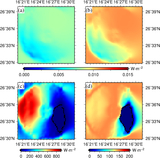
Caption: Figure 5.
Comparison between the orbital images and the simulated illumination results over the study area. Panels (a) and (b) show the orbital NAC images from the LROC products M1415076933RE/LE and M1443223691RE/LE, respectively. Panels (c) and (d) present the DEM-based simulated illumination maps without smoothing, whereas panels (e) and (f) show the corresponding Gaussian-smoothed results. For ease of comparison among panels, the simulated illumination intensity is normalized to the range 0–1, and the color scale indicates the normalized illumination.
Other Images in This Article
Copyright and Terms & Conditions
© 2026. The Author(s). Published by the American Astronomical Society.
Copyright ©
2026 Astronomy Image Explorer. All Rights Reserved.