Image Details
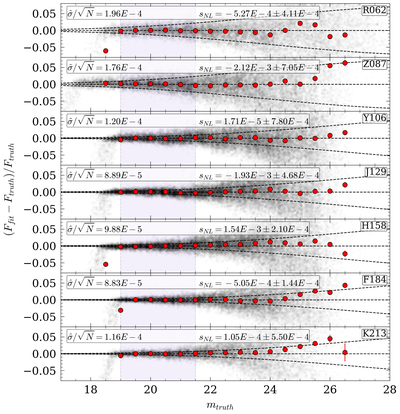
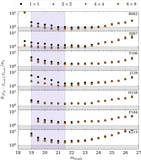
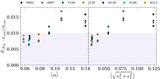
Caption: Figure 2.
Photometric recovery, in terms of fractional flux difference, for field stars in one pointing from OpenUniverse2024. Black points represent each individual star. Red points are (Ftruth − Ffit)/Ftruth binned every 0.5 mag, with error bars showing the standard deviation of that bin. Field stars are located based on truth coordinates, and the PSF is constructed using photutils.psf.EPSFBuilder (J. Anderson & I. R. King 2000; J. Anderson 2016; L. Bradley et al. 2024) for an 8 × 8 grid. The shaded purple region, 19 ≤ mtruth ≤ 21.5, shows the magnitude range over which stars were selected for PSF construction, as well as zero-point calculation. Curved black dashed lines represent Poisson noise for the stars only (i.e., background is excluded). ﹩\hat{\sigma }﹩ is the modified median absolute deviation assuming a normal distribution (Equation (1)), and sNL is the slope of the binned data (nonlinearity) in the shaded purple region excluding the bin at mtruth = 19. The median of all panels is zero by design; the flux measurements are zero pointed to the truth catalog for 19 ≤ mtruth ≤ 21.5.
Other Images in This Article
Show More
Copyright and Terms & Conditions
© 2026. The Author(s). Published by the American Astronomical Society.