Image Details
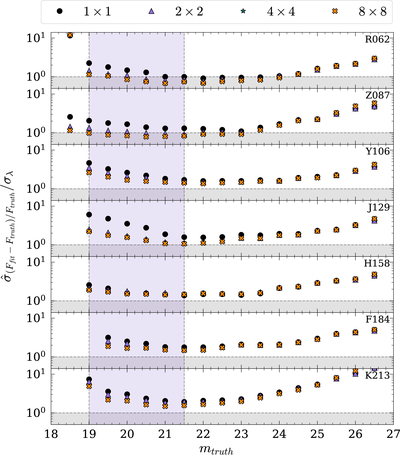
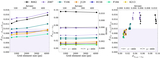
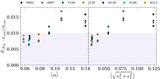
Caption: Figure 5.
The vertical axis values in Figure 3 divided by Poisson noise (σλ). Each color and marker style represents a different grid size (see legend). The shaded purple region is 19 < mtruth < 21.5, and the shaded gray region is where ﹩\hat{\sigma }/{\sigma }_{\lambda }\geqslant 1﹩.
Other Images in This Article
Show More
Copyright and Terms & Conditions
© 2026. The Author(s). Published by the American Astronomical Society.
Copyright ©
2026 Astronomy Image Explorer. All Rights Reserved.