Image Details
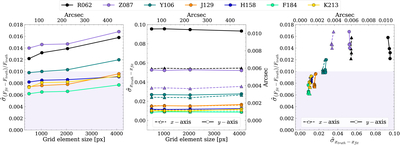
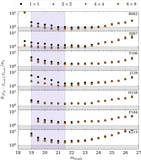
Caption: Figure 4.
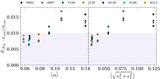
Left: the modified median absolute deviation (﹩\hat{\sigma }﹩), assuming a normal distribution, of the fractional difference between truth catalog flux and the fit PSF photometry flux as a function of grid element size in pixels. Center: ﹩\hat{\sigma }﹩, assuming a normal distribution, of the difference between truth catalog pixel coordinates and fit pixel coordinates. Right: ﹩\hat{\sigma }﹩ of the fractional flux differences from the left panel compared to the pixel locations in the center panel. Circular markers with solid lines correspond to the x-coordinates, and triangles with dashed lines correspond to y-coordinates. The shaded purple region represents <1% flux precision. This figure corresponds with the results in Table 2.
Other Images in This Article
Show More
Copyright and Terms & Conditions
© 2026. The Author(s). Published by the American Astronomical Society.