Image Details
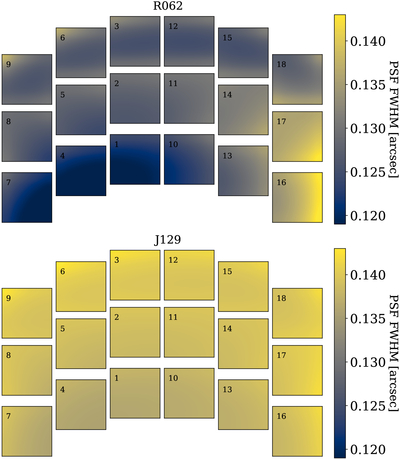
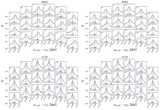
Caption: Figure 1.
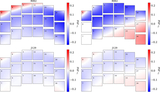
Focal plane variation of the PSF FWHM for different Roman bandpasses, assuming a flat spectral energy distribution. The shown positional dependence on the focal plane arises from optical aberrations alone and does not include any detector effects. The PSFs include the pixel response at the native scale but are oversampled by a factor of 8 in order to measure the sizes. The sizes are measured using adaptive weighted moments in GalSim. This plot is formatted to reflect Roman’s detector shape and arrangement of all 18 SCAs.
Other Images in This Article
Show More
Copyright and Terms & Conditions
© 2026. The Author(s). Published by the American Astronomical Society.
Copyright ©
2026 Astronomy Image Explorer. All Rights Reserved.