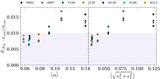
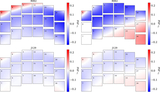
Image Details
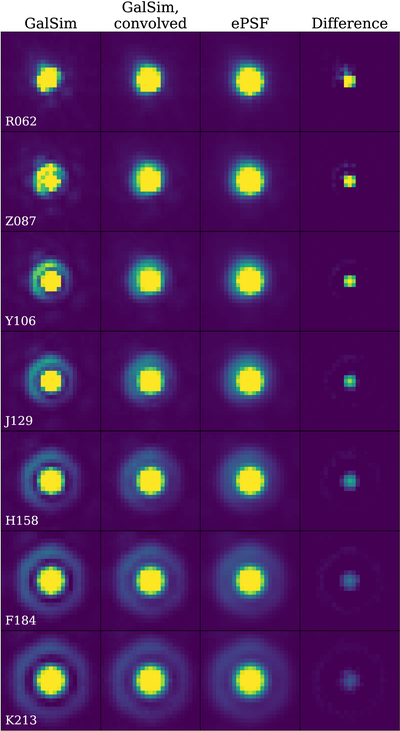
Caption: Figure 8.
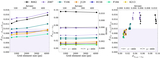
First (left) column: injected GalSim PSFs for the all Roman filters at the same location on the same SCA. Second column: GalSim PSFs from the first column, after convolution with the Roman pixel response. Third column: ePSFs from the 8 × 8 grid for the same location as the GalSim PSFs. Fourth column: the difference between the second and third columns. All PSFs are shown with the same color scale, and all have an oversampling factor of 3. The left three columns are normalized such that the values sum to 1. The right column is not normalized after subtracting the normalized third column from the normalized second column. Asymmetry in the displayed PSFs is caused by Roman’s optical system.
Other Images in This Article
Show More
Copyright and Terms & Conditions
© 2026. The Author(s). Published by the American Astronomical Society.