Image Details
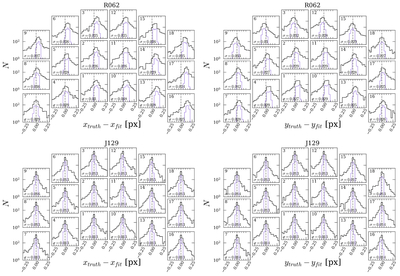
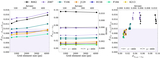
Caption: Figure 7.
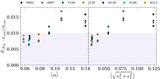
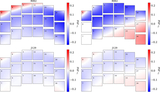
Top: star location offsets in pixel coordinates for an 8 × 8 grid, arranged by individual SCA. The black line is all stars, and the purple line is stars with 19 < mtruth < 21.5. Bottom: the same for the J129 band. This plot is formatted to reflect Roman’s detector shape and SCA arrangement. σ is the standard deviation of the purple line. We choose to show the R062 and J129 bands to illustrate this discussion point (Figures 4 and 10) because they have the largest and smallest differences, respectively, in their x- and y-coordinate recovery precision (Table 2).
Other Images in This Article
Show More
Copyright and Terms & Conditions
© 2026. The Author(s). Published by the American Astronomical Society.
Copyright ©
2026 Astronomy Image Explorer. All Rights Reserved.