Image Details
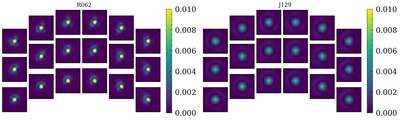
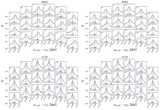
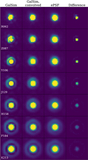
Caption: Figure 11.
GalSim PSFs, unconvolved with the Roman pixel response, at the center of each SCA. All PSFs are oversampled by a factor of 9. This plot is formatted to reflect Roman’s detector shape and SCA arrangement. Note that for the bottom two rows of the detector, the x-axis is defined such that the origin is at the bottom-right corner of the detectors, and positive x points left (M. A. Troxel et al. 2023).
Other Images in This Article
Show More
Copyright and Terms & Conditions
© 2026. The Author(s). Published by the American Astronomical Society.
Copyright ©
2026 Astronomy Image Explorer. All Rights Reserved.