Image Details
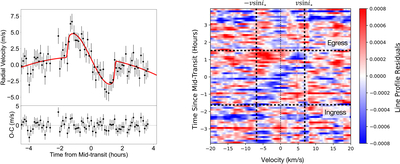
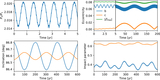
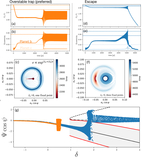
Caption: Figure 1.
Left: RV variations during transit of TOI-4495 c (RM effect). The black points are KPF data, and the red curve shows the best-fit RM model with sky-projected stellar obliquity of ﹩\lambda =-2.{3}_{-7.8}^{+8.3}\,^\circ ﹩. The bottom panel shows the residuals of the data subtracted by the best-fit model. Right: line-profile residuals as a function of time and velocity. The vertical black dashed lines mark the ﹩v\sin {i}_{* }=6.8\pm 0.6﹩ km s−1 of the host star. The horizontal black dashed lines indicate the ingress and egress timing of transit. The blue diagonal feature, extending from −6.8 km s−1 at ingress to 6.8 km s−1 at egress, represents the Doppler shadow of TOI-4495 c and is consistent with a well-aligned orbit.
Other Images in This Article
Copyright and Terms & Conditions
© 2026. The Author(s). Published by the American Astronomical Society.