Image Details
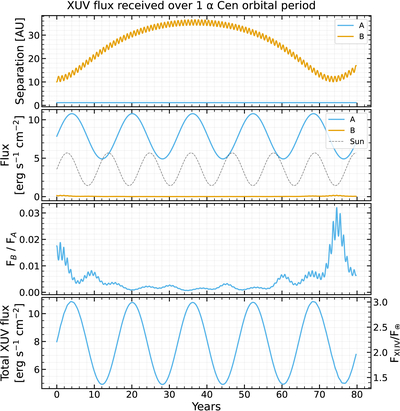
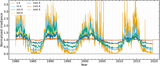
Caption: Figure 12.
XUV (λ < 912 Å) flux received by a hypothetical planet orbiting α Cen A at 1.2 au over the course of one stellar orbital period. The panels show, from top to bottom: first: solid lines show the distance of the planet from α Cen A and B. The separation from α Cen A is constant at 1.2 au. Second: The XUV flux received at the planet from each star. The dashed gray line shows the XUV flux that Earth receives from the Sun for comparison. Third: the ratio of flux received from α Cen B compared to α Cen A. Fourth: the left side axis shows total XUV flux received from both stars. The right side axis shows the ratio of the total XUV flux at the planet compared to the average XUV flux Earth receives from the Sun.
Other Images in This Article
Show More
Copyright and Terms & Conditions
© 2026. The Author(s). Published by the American Astronomical Society.