Image Details
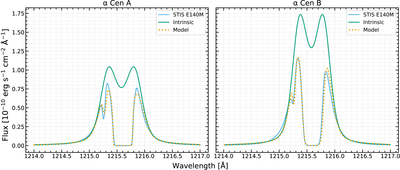
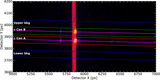
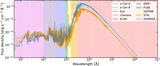
Caption: Figure 11.
Reconstructed Lyα emission line profiles for α Cen A (left) and B (right). The blue line represents the observed data from HST/STIS E140M, the green line is the reconstructed intrinsic profile from the A. Youngblood et al. (2022) model, and the dashed orange line is the model fit to the observed data.
Other Images in This Article
Show More
Copyright and Terms & Conditions
© 2026. The Author(s). Published by the American Astronomical Society.
Copyright ©
2026 Astronomy Image Explorer. All Rights Reserved.