Image Details
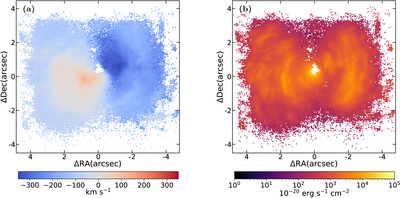
Caption: Figure 6.
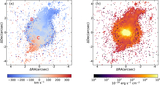
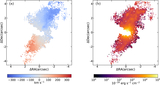
Velocity and flux maps of the Hα emission line for MR 2251-178, derived using the selection method. (a) The line center velocity map of Hα narrow component. (b)The flux map of Hα narrow component. Only spaxels where the peak of the Hα line is detected with SNR > 5 are plotted.
Other Images in This Article

Show More
Copyright and Terms & Conditions
© 2026. The Author(s). Published by the American Astronomical Society.
Copyright ©
2026 Astronomy Image Explorer. All Rights Reserved.