Image Details
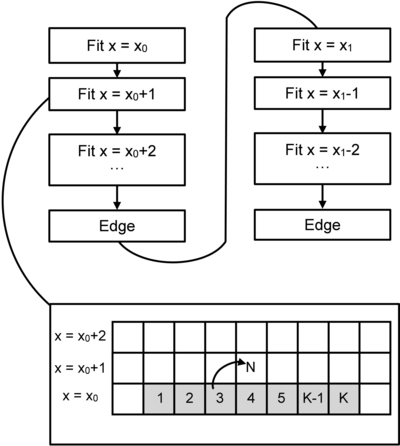
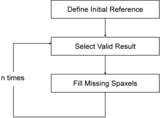
Caption: Figure 3.
Flowchart of the fitting process when x1 > x0. The lower inset illustrates the fitting process for row x0 + 1. For each spectrum (spaxel N) in row x0 + 1, the initial guess for the fitting is determined by the result with the minimum ﹩{\chi }_{{\rm{red}}}^{2}﹩ among the k neighboring spectra(spaxel 1, 2, 3…k) from row x0.
Other Images in This Article
Show More
Copyright and Terms & Conditions
© 2026. The Author(s). Published by the American Astronomical Society.
Copyright ©
2026 Astronomy Image Explorer. All Rights Reserved.