Image Details
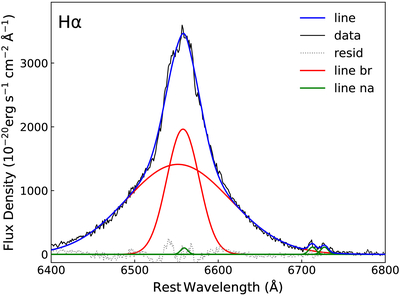
Caption: Figure 7.
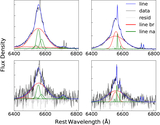
Gaussian decomposition result for the Hα emission line in the innermost region of MR 2251-178. The black solid line illustrates the observed data, while the blue solid line depicts the best-fitting model. The model consists of both broad (red solid line) and narrow (green solid line) emission lines. The gray dashed line represents the residuals of the emission-line fitting.
Other Images in This Article
Show More
Copyright and Terms & Conditions
© 2026. The Author(s). Published by the American Astronomical Society.
Copyright ©
2026 Astronomy Image Explorer. All Rights Reserved.