Image Details
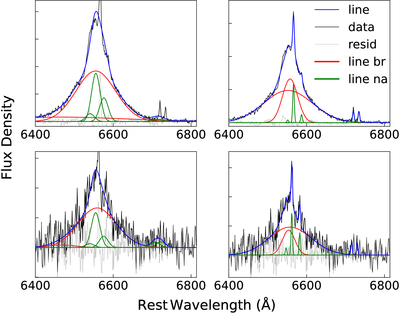
Caption: Figure 8.
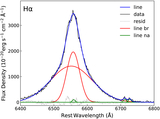
Examples of Gaussian decomposition results for the Hα emission line in MR 2251-178 before and after improvement. The left column shows the fitting results obtained with default Gaussian parameter guesses, and the right column displays the results selected by our algorithm. The first row corresponds to spectra from the central region (“A” in Figure 2), and the second row shows spectra from the outer region (“B” in Figure 2). The black solid line illustrates the observed data, while the blue solid line depicts the best-fitting model. The model consists of both broad (red solid line) and narrow (green solid line) emission lines. The gray dashed line represents the residuals of the emission-line fitting.
Other Images in This Article
Show More
Copyright and Terms & Conditions
© 2026. The Author(s). Published by the American Astronomical Society.