Image Details
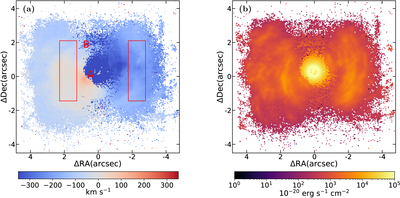
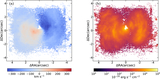
Caption: Figure 2.
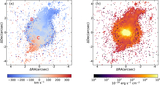
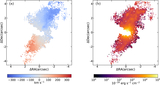
Velocity and flux maps of the Hα emission line for MR 2251-178. (a) The line center velocity map of Hα narrow component. (b)The flux map of Hα narrow component. Only spaxels where the peak of the Hα line is detected with SNR > 5 are plotted. The red boxes indicate regions used as references for the selection.
Other Images in This Article
Show More
Copyright and Terms & Conditions
© 2026. The Author(s). Published by the American Astronomical Society.
Copyright ©
2026 Astronomy Image Explorer. All Rights Reserved.