Image Details
Caption: Figure 1.
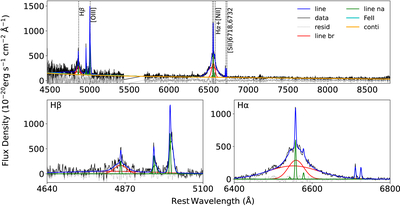
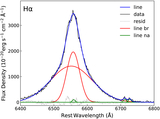
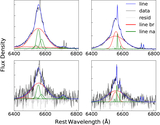
Example of spectral fitting results. In the upper panel, the black solid line illustrates the observed data, and the blue solid line depicts the best-fitting model obtained from PyQSOFit. The model includes the continuum (orange solid line), Fe II emission (cyan solid line), and emission lines (red solid line for broad emission lines, green solid line for narrow emission lines). The gray dashed line represents the residuals of the spectral fitting. The bottom two panels show the emission-line fitting results of the Hβ and Hα regions, respectively.
Other Images in This Article
Show More
Copyright and Terms & Conditions
© 2026. The Author(s). Published by the American Astronomical Society.
Copyright ©
2026 Astronomy Image Explorer. All Rights Reserved.