Image Details
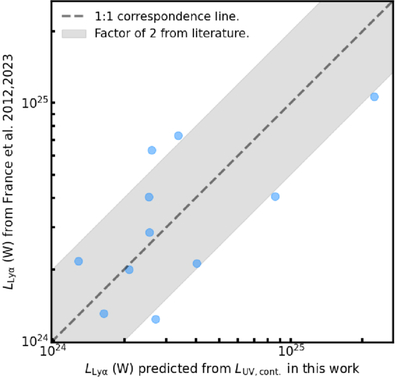
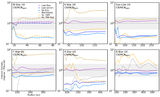
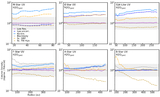
Caption: Figure 12.
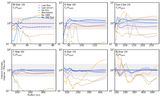
Plot of Lyα luminosities for stars as estimated in Appendix A (x-axis), compared to their Lyα luminosities as reported in K. France et al. (2012, 2023; y-axis). The 1:1 correspondence line is shown in dashed black, and a factor of 2 away from the literature values is shaded in gray.
Other Images in This Article
Show More
Copyright and Terms & Conditions
© 2026. The Author(s). Published by the American Astronomical Society.
Copyright ©
2026 Astronomy Image Explorer. All Rights Reserved.