Image Details
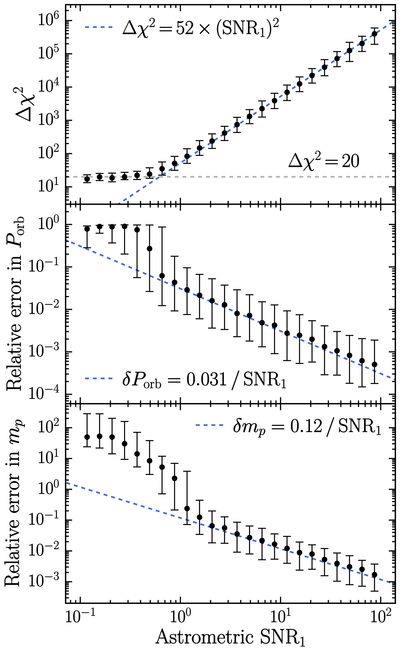
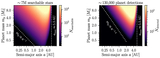
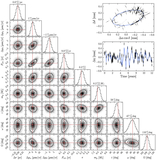
Caption: Figure 11.
Results of orbit-fitting experiments with simulated Gaia DR5 data. The points represent median values, and the error bars indicate 1σ ranges. Blue dashed lines show fits to the SNR1 > 2 results. The top panel shows the Δχ2 between the best-fit one-companion and no-companion models, vs. SNR1, the SNR of each astrometric data point (Equation (7)). When SNR1 is below about 0.5, Δχ2 ≈ 20. For SNR1 ≳ 1 there is a relatively tight relationship (within a factor of ∼2) between SNR1 and Δχ2. The middle panel shows the relative error in the recovered orbital period, δPorb = 1 − Precov/Ptrue, vs. SNR1. δPorb drops steadily with SNR1. The relative error in the recovered planet mass vs. SNR1 is shown in the bottom panel. Planet masses are accurately recovered when SNR1 ≳ 4, and become increasingly accurate at larger SNR1.
Other Images in This Article
Show More
Copyright and Terms & Conditions
© 2025. The Author(s). Published by the American Astronomical Society.