Image Details
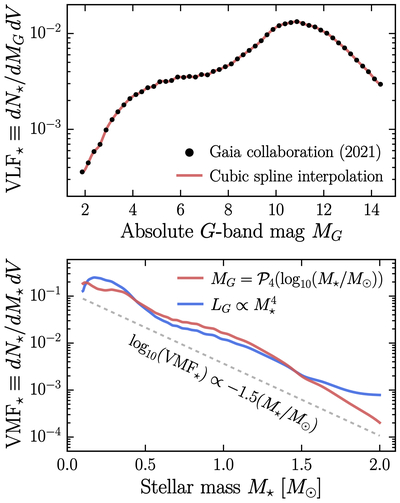
Caption: Figure 3.
The top panel shows the G-band VLF for main-sequence stars within 100 pc (Gaia Collaboration et al. 2021). A cubic spline interpolation is shown in red. The bottom panel shows the corresponding VMF, based on the two choices for the mass–magnitude relations in Figure 2. For reference, a simple exponential approximation is plotted in gray. In both panels, the units of volume and mass are pc3 and M⊙, respectively.
Other Images in This Article
Show More
Copyright and Terms & Conditions
© 2025. The Author(s). Published by the American Astronomical Society.
Copyright ©
2025 Astronomy Image Explorer. All Rights Reserved.