Image Details
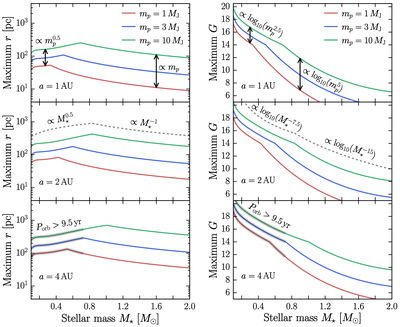
Caption: Figure 5.
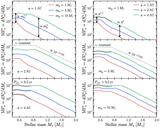
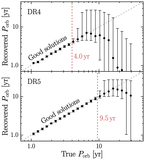
Predictions for the maximum distance (left column) and maximum apparent G-band magnitude (right column) of stars for which Gaia can detect planets in DR5. Within each panel, curves are shown for three different planet masses. Each of the three panels is for a different orbital distance. The kinks are due to the break in our model for Gaia’s astrometric precision as a function of apparent magnitude (Figure 4). In the middle panel of each column, the gray dashed curve shows the scaling expected from a simple analytic model. In the top panels, the arrows indicate how the vertical spacing between curves scales with planet mass. In the bottom panels, the gray bands highlight the cases for which the orbital period exceeds 9.5 yr, which will make astrometric detection challenging. The most distant stars for which Gaia can detect planets are several hundred parsecs away. The faintest G magnitude depends sensitively on stellar mass.
Other Images in This Article
Show More
Copyright and Terms & Conditions
© 2025. The Author(s). Published by the American Astronomical Society.