Image Details
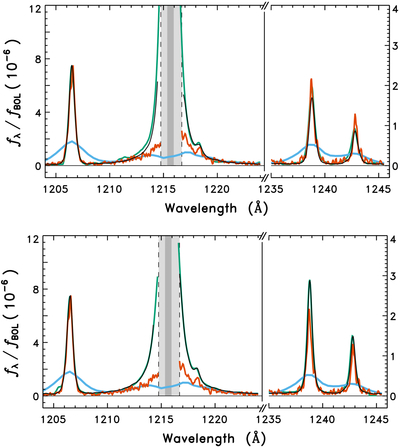
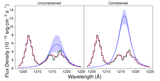
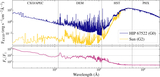
Caption: Figure 7.
A comparison of the COS and STIS spectra of HIP 67522 with those of EK Dra (top) and DS Tuc (bottom). The left inset in each panel shows Si III λ1206 and Lyα, while the right has the N V doublet; note the y-axis scale change to accommodate the fainter N V emissions. For HIP 67522, In both panels, red curve is the COS G130M spectrum and the blue curve is the STIS G140L spectrum. The spectra have been normalized by their bolometric fluxes, fBOL. In the top panel, the COS G130M spectrum of EK Dra is in black and the STIS E140M spectrum in green. In the bottom panel, the COS G130M spectrum of DS Tuc is in black and the STIS G140M in green. The vertical dashed lines show the approximate wavelength range normally affected by geocoronal Lyα for COS G130M; the inner darker shaded band is where the IS Lyα absorption occurs (based on STIS medium-resolution E140M spectrum of EK Dra, at d = 34 pc). In both plots, the wavelength scales were registered by adjusting the flux-weighted wavelength of Si III to the laboratory value 1206.500 Å. The y-axis is the ISM-corrected bolometrically normalized flux for HIP 67522, while the other star has been smoothed in wavelength, and scaled in f/fBOL, to match the apparent line shape of Si III for HIP 67522. The smoothing utilized a pseudo-Gaussian profile: normal exponent α = 2 replaced by α = 1.25 yielding a sharper core plus broader wings than normal Gaussian (based on empirical experimentation).
Other Images in This Article
Show More
Copyright and Terms & Conditions
© 2025. The Author(s). Published by the American Astronomical Society.