Image Details
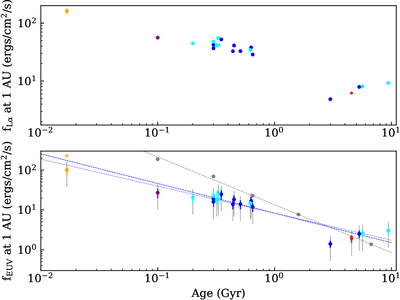
Caption: Figure 10.
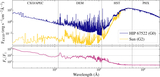
Shown in the top panel are the integrated Lyα line fluxes for the stars given in Table 6. The fluxes are normalized to a distance of 1 au and the radius of a 1 M⊙ star at that age. HIP 67522 is plotted in orange. The Sun is plotted as a red star. EK Dra is plotted in purple. Stars shown in blue have spectral types from G0V to G5V, while stars shown in cyan have spectral types from G6V–G8V. Shown in the bottom panel is the 10–40 nm EUV flux density estimated using the scaling relations from Lyα given in Table 5 of J. L. Linsky et al. (2013). The colored error bars on the EUV fluxes show the uncertainty from the scaling relation equations, while the light gray bars show the propagated deviation about the fits from J. L. Linsky et al. (2013). Plotted as an orange cross is the integrated EUV flux from the DEM model for HIP 67522. Also plotted in gray are the 10–36 nm EUV flux densities and best fit from R05 (their Table 4). The two blue lines show linear fits to the EUV fluxes estimated in this paper, with the dotted line showing the best fit when the EUV point for HIP 67522 is taken from the Lyα scaling and the dashed line when the DEM flux is used.
Other Images in This Article
Show More
Copyright and Terms & Conditions
© 2025. The Author(s). Published by the American Astronomical Society.