Image Details
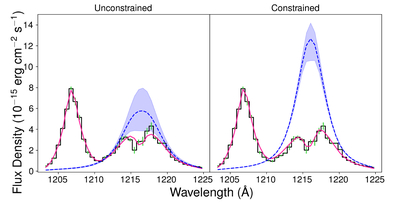
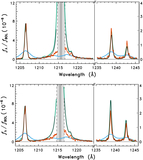
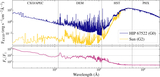
Caption: Figure 4.
Lyα reconstructions. In both panels, the STIS data are shown in black and the model fits (intrinsic Lyα profile folded through the ISM) in red. The dotted blue lines show the reconstructed, intrinsic stellar Lyα emission with 1σ uncertainties in shadow. The left panel shows the unconstrained parameter fitting. The reconstructed (unattenuated) Lyα flux is ﹩4.{2}_{-0.8}^{+1.0}\times 1{0}^{-14}﹩ erg cm−2 s−1 for a derived ISM absorption of ﹩{\mathrm{log}}\,({N}_{{\rm{H}}\,{\rm{I}}})=18.8{0}_{-0.63}^{+0.27}﹩. The right panel shows the fit when the IS column density is fixed to ﹩{\mathrm{log}}\,({N}_{{\rm{H}}\,{\rm{I}}})=19.36﹩. The reconstructed (unattenuated) Lyα flux is ﹩7.1{9}_{-0.53}^{+0.42}\times 1{0}^{-14}﹩ erg cm−2 s−1.
Other Images in This Article
Show More
Copyright and Terms & Conditions
© 2025. The Author(s). Published by the American Astronomical Society.