Image Details
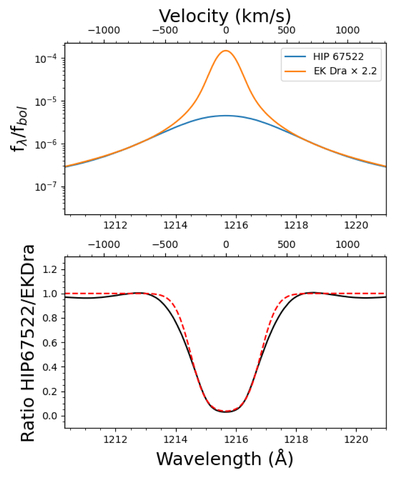
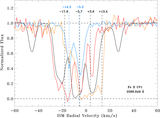
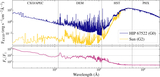
Caption: Figure 8.
A comparison between HIP 67522’s reconstructed Lyα profile and EK Dra’s (top) provides an estimate of the extra H I absorption present in the system (bottom). Top: HIP 67522’s intrinsic Lyα profile as estimated via the “constrained” reconstruction is shown in blue and EK Dra’s intrinsic Lyα profile is shown in orange. Both profiles have been normalized by fbol, and EK Dra’s profile has been shifted in wavelength to match HIP 67522’s radial velocity and multiplied by 2.2× to match HIP 67522’s flux density beyond >500 km s−1. Bottom: the ratio of the shifted and scaled profiles reveals a deep and broad absorption profile, representing an estimate of the extra absorption that may be present in the system. The ratio is shown in black, while the dotted red line is the fit to the residual absorption.
Other Images in This Article
Show More
Copyright and Terms & Conditions
© 2025. The Author(s). Published by the American Astronomical Society.