Image Details
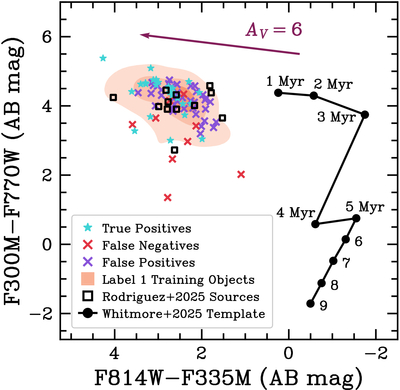
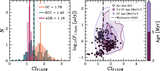
Caption: Figure 11.
F300M – F770W vs. F814W – F335M diagram for consistent Label 1 test objects for models without Paα and F150W data. The black line is the mean empirical template from B. C. Whitmore et al. (2025) for ages of 1–9 Myr (black dots), as this range spans just beyond the timescale we expect for embedded sources (M. J. Rodríguez et al. 2025; L. Ramambason 2025, in preparation; B. C. Whitmore et al. 2025). The reddening vector (maroon) is for AV = 6, representative of the median we derive in Section 5.2.2 for our by-eye sample.
Other Images in This Article
Show More
Copyright and Terms & Conditions
© 2025. The Author(s). Published by the American Astronomical Society.
Copyright ©
2025 Astronomy Image Explorer. All Rights Reserved.