Image Details
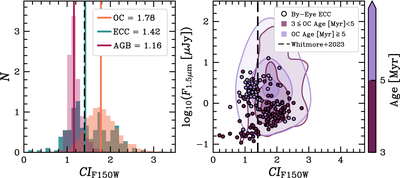
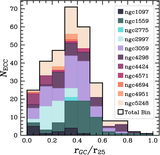
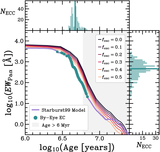
Caption: Figure 7.
Left: normalized histogram of 181 of our embedded cluster candidates (ECC, cyan), 1117 AGB stars (AGB, pink), and 2308 HST Class 1+2 optical clusters (OC, orange; D. Maschmann et al. 2024) with F150W concentration index CIF150W greater than zero and a peak S/N > 5. Bins are normalized to the total number of objects and the bin width. The solid vertical lines indicate the median for each distribution of objects. The bimodal distribution of the embedded cluster candidates may be indicative of evolved stars present within our by-eye sample. Right: F150W surface brightness against CIF150W, where color indicates the age derived via Paα equivalent-width age dating. The scatter shows our embedded cluster candidates, and the contours denote the 10th, 50th, and 90th percentiles of HST Class 1+2 optical clusters for 3–5 Myr (dark purple) and greater than 5 Myr (light purple). The dashed vertical line at CI = 1.4 marks the limit B. C. Whitmore et al. (2023) uses to distinguish between stars and clusters in the JWST F200W band. The median CIF150W is 1.22 for embedded cluster candidates with ages greater than 5 Myr and 1.69 for sources in the 3–5 Myr age bin.
Other Images in This Article
Show More
Copyright and Terms & Conditions
© 2025. The Author(s). Published by the American Astronomical Society.