Image Details
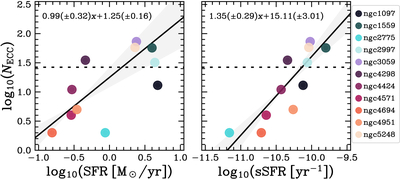
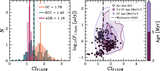
Caption: Figure 3.
Number of embedded cluster candidates vs. global star formation properties. Values for each galaxy are in Table 1, and embedded cluster candidate counts from this study are in Table 4. Left: ﹩{{\rm{log}}}_{10}({\rm{SFR}})﹩ vs. number of embedded cluster candidates. Right: ﹩{{\rm{log}}}_{10}({\rm{sSFR}})﹩ vs. number of embedded cluster candidates. The black line in each plot shows the linear fit to the data with the ±1σ region of the fit in light gray. We exclude NGC 2997 and NGC 1097 in fitting due to a lack of wide coverage. The number of embedded cluster candidates positively correlates with each of these properties.
Other Images in This Article
Show More
Copyright and Terms & Conditions
© 2025. The Author(s). Published by the American Astronomical Society.