Image Details
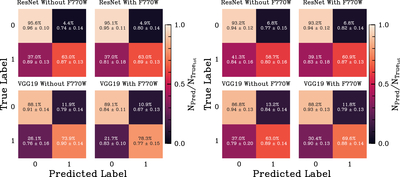
Caption: Figure 9.
Confusion matrices for all eight model configurations, normalized to the number of objects tested in each “True Label” category (see Table 3 for the number of objects in each class). The numbers below the percentages are the average and standard deviation of the model agreement in each quadrant. Left: confusion matrices for models that include F150W and Paα data in training. Right: confusion matrices for models which exclude F150W and Paα data in training.
Other Images in This Article
Show More
Copyright and Terms & Conditions
© 2025. The Author(s). Published by the American Astronomical Society.
Copyright ©
2025 Astronomy Image Explorer. All Rights Reserved.