Image Details
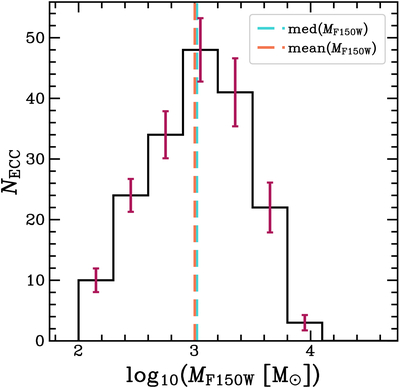
Caption: Figure 8.
A histogram of the distribution of masses for the subset of 186 embedded cluster candidates with an F150W peak pixel S/N > 5. There are two sources with mass estimates below 102 M⊙ not shown. The maroon error bars show the 1σ standard deviations from Monte Carlo simulations for each bin with at least one embedded cluster candidate.
Other Images in This Article
Show More
Copyright and Terms & Conditions
© 2025. The Author(s). Published by the American Astronomical Society.
Copyright ©
2025 Astronomy Image Explorer. All Rights Reserved.