Image Details
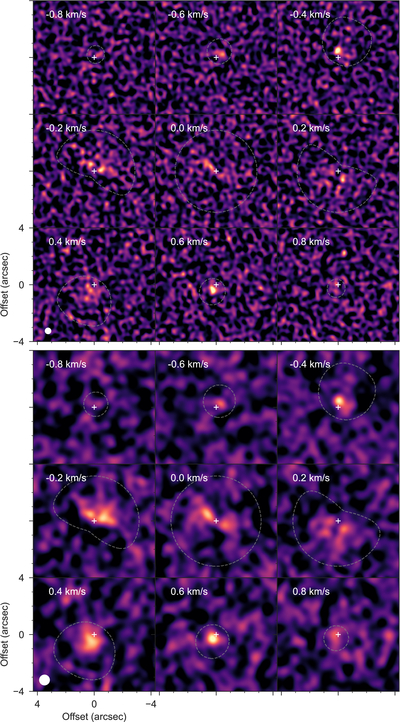
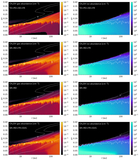
Caption: Figure 13.
Stacked channel map of the methanol (CH3OH) transitions with matched filter detections. The top plot shows the 0﹩\mathop{.}\limits^{^{\prime\prime} }﹩4 observations, while the bottom plot shows the 0﹩\mathop{.}\limits^{^{\prime\prime} }﹩7 observations. Each panel is shown on a linear stretch normalized to the maximum value across each image cube.
Other Images in This Article
Show More
Copyright and Terms & Conditions
© 2025. The Author(s). Published by the American Astronomical Society.
Copyright ©
2025 Astronomy Image Explorer. All Rights Reserved.