Image Details
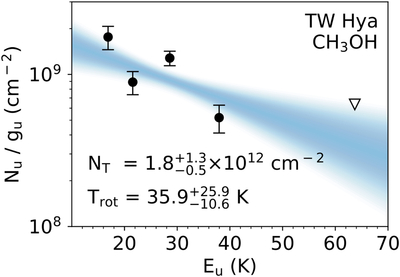
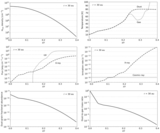
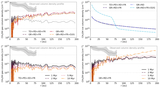
Caption: Figure 3.
Rotational diagram calculated from the disk-integrated values of the 0﹩\mathop{.}\limits^{^{\prime\prime} }﹩7 observations. Upper limits are denoted with a downward triangle, random draws from the corresponding posterior probability distribution are shown in blue, and median values with their uncertainties are labeled.
Other Images in This Article
Show More
Copyright and Terms & Conditions
© 2025. The Author(s). Published by the American Astronomical Society.
Copyright ©
2025 Astronomy Image Explorer. All Rights Reserved.