Image Details
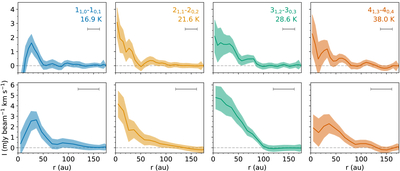
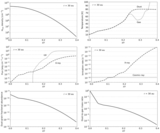
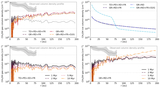
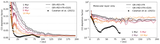
Caption: Figure 2.
Radial profiles of emission for the detected methanol (CH3OH) transitions. The upper panels show the 0﹩\mathop{.}\limits^{^{\prime\prime} }﹩4 observations, while the lower panels show the 0﹩\mathop{.}\limits^{^{\prime\prime} }﹩7 observations. Transitions are labeled with Eu, shaded regions indicate 1σ uncertainties, and the beam FWHM is shown with a horizontal bar.
Other Images in This Article
Show More
Copyright and Terms & Conditions
© 2025. The Author(s). Published by the American Astronomical Society.
Copyright ©
2025 Astronomy Image Explorer. All Rights Reserved.