Image Details
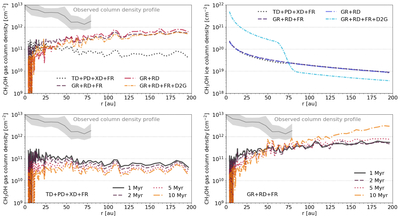
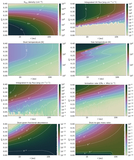
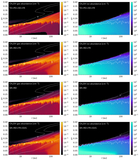
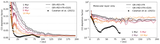
Caption: Figure 9.
Column density of gas-phase (top left) and ice-phase (top right) methanol as a function of disk radius, r, at a time of 1 Myr. Shown in the top panels are the results from the four models that predict the highest column density of gas-phase methanol at 30 au: TD+PD+XD+FR (dotted lines), GR+RD+FR (dashed lines), GR+RD (dotted–dashed lines), and GR+RD+FR+D2G (tight dotted–dashed lines). All model ingredients are listed in Table 2. Shown in the bottom panels are the results from two models, one without (TD+PD+XD+FR; bottom left) and with (GR+RD+FR; bottom right) grain-surface chemistry and reactive desorption, at times of 1, 2, 5, and 10 Myr. The gray shaded region in the gas-phase column density plots shows the column density profile inferred from the observations (see Figure 3).
Other Images in This Article
Show More
Copyright and Terms & Conditions
© 2025. The Author(s). Published by the American Astronomical Society.