Image Details
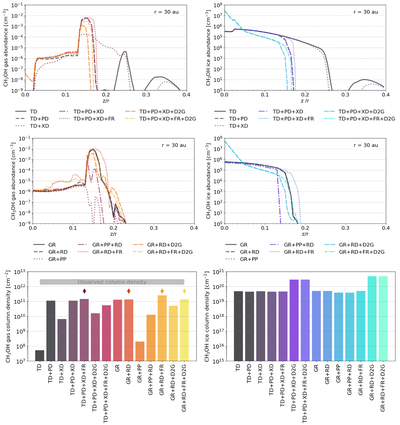
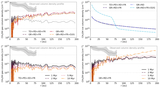
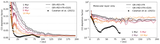
Caption: Figure 6.
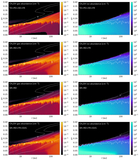
Abundance (top and middle; cm−3) and column density (bottom; cm−2) of methanol gas (left) and ice (right) as a function of z/r (i.e., height divided by radius) at a radius of 30 au. The top row shows results from models with thermal desorption only (TD), with the addition of photodesorption (+PD) and X-ray desorption (+XD), treating the grains as fractal (+FR) and scaling the ice mass by the dust-to-gas mass ratio (+D2G). The middle row shows the results from models, also including all listed desorption mechanisms and grain-surface chemistry (GR), with the addition of reactive desorption (+RD), photo-processing of the ice (+PP), treating the grains as fractal (+FR), and scaling the ice mass by the dust-to-gas mass ratio (+D2G). The disk-averaged column density of gas-phase methanol derived from the observations (﹩1.{8}_{-0.5}^{+1.3}\times 1{0}^{12}﹩ cm−2) is shown by the gray box in the bottom left plot. The starred models in the bottom left plot are those for which the methanol gas column density is highest and thus for which the full models were run.
Other Images in This Article
Show More
Copyright and Terms & Conditions
© 2025. The Author(s). Published by the American Astronomical Society.