Image Details
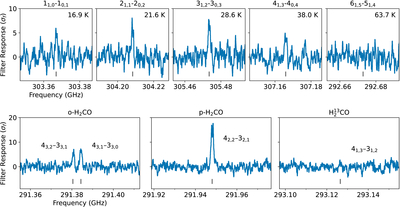
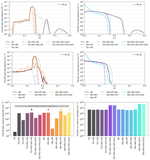
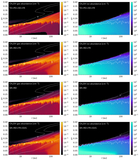
Caption: Figure 12.
Matched filter response across the spectral windows containing methanol (CH3OH) transitions using a Keplerian mask with a radius of 50 au (top) and the remaining spectral windows with a mask of radius 100 au (bottom). Rest frequencies of the labeled transitions are marked with vertical dashes. See J. Terwisscha van Scheltinga et al. (2021) for an analysis of the H2CO emission.
Other Images in This Article
Show More
Copyright and Terms & Conditions
© 2025. The Author(s). Published by the American Astronomical Society.
Copyright ©
2025 Astronomy Image Explorer. All Rights Reserved.