

Image Details
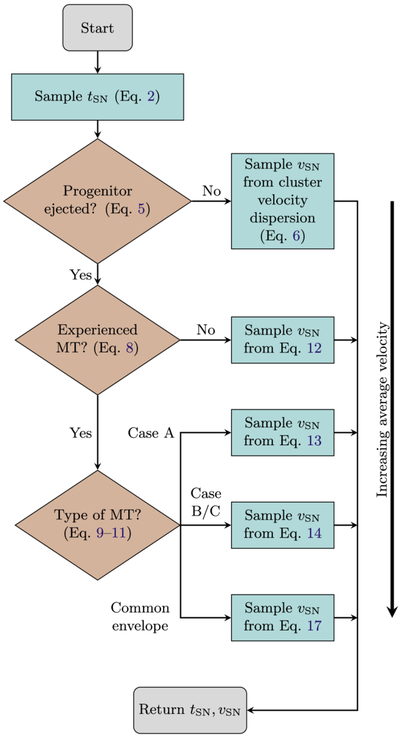
Caption: Figure B1.
A flowchart of the sampling routine for our analytic model of SN feedback, where ﹩{t}_{{\rm{SN}}}﹩ is the time of the SN and ﹩{v}_{{\rm{SN}}}﹩ is the velocity at which its progenitor moves away from its parent cluster. Based on the sampled time, we draw a progenitor velocity, ﹩{v}_{{\rm{SN}}}﹩. The distribution for this velocity changes based on (a) whether the progenitor was ejected from its binary and, if so, (b) whether it experienced mass transfer before doing so, and, if so, (c) what type of mass transfer it experienced. The velocity distributions are sorted in this flowchart from top to bottom, from slowest to fastest (where unejected progenitors proceed slowest on average, while stars ejected after a common envelope are typically fastest).
Other Images in This Article
Show More
Copyright and Terms & Conditions
© 2025. The Author(s). Published by the American Astronomical Society.

