

Image Details
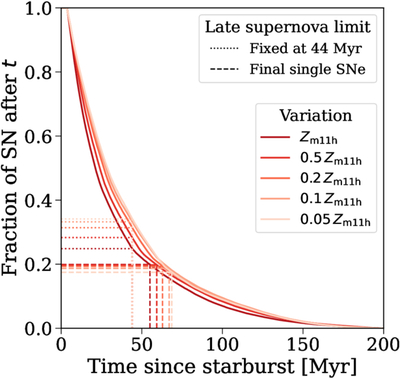
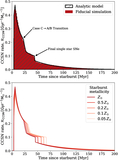
Caption: Figure A1.
The fraction of SNe that occur after a given time for the difference metallicity variations we consider are shown in colored lines. The dotted lines indicate the fraction of late SNe when using a fixed 44 Myr limit. The dashed lines show the same fraction when using a limit set by the time of the last single star SN. The fixed limit results in a negative correlation of the late SNe fraction with metallicity, while the variable limit gives a positive correlation.
Other Images in This Article
Show More
Copyright and Terms & Conditions
© 2025. The Author(s). Published by the American Astronomical Society.

Copyright ©
2026 Astronomy Image Explorer. All Rights Reserved.
